728x90
색상
- HTML 색상 표현
- RGB 16진수로 표현
- 0~255 정수값 (r, g, b) 튜플 형태로 표현
- 0~1 사이의 부동소수점 a가 추가된 (r, g, b, a) 튜플 형태로 표현
플롯 (Plots)
x = np.random.randint(1, 10, 10)
y = np.random.randint(1, 10, 10)

p = figure(plot_width=400, plot_height=400)
p.outline_line_width = 10
p.outline_line_alpha = 0.5
p.outline_line_color = "orange"
p.circle(x, y, color="red", size=10)
show(p)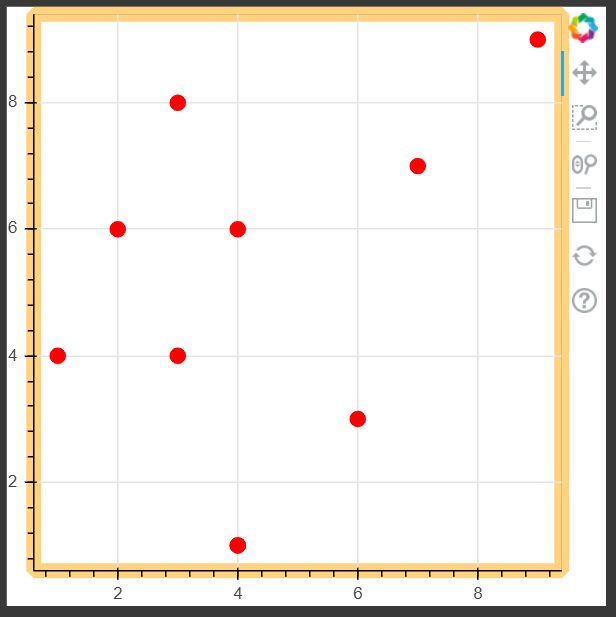
글리프 (Glyphs)
p = figure(plot_width=400, plot_height=400)
r = p.circle(x, y)
r.glyph.size = 50
r.glyph.fill_alpha = 0.2
r.glyph.line_color = "orange"
r.glyph.line_dash = [5, 1]
r.glyph.line_width = 2
show(p)
p = figure(plot_width=400, plot_height=400, tools="tap")
r = p.circle(x, y, size=50,
             selection_color="royalblue",	# 클릭 된 객체 속성 변경
             nonselection_fill_alpha=0.3,	# 클릭되지 않은 객체들 속성 변경
             nonselection_fill_color="gray",
             nonselection_line_color="royalblue",
             nonselection_line_alpha=0.8)
show(p)

from bokeh.models.tools import HoverTool
from bokeh.sampledata.glucose import data

subset = data.loc['2010-05-01']
x, y = subset.index.to_series(), subset['glucose']

p = figure(width=800, height=300, x_axis_type="datetime")
p.line(x, y, line_dash="2 2", line_width=2, color="gray")
cr = p.circle(x, y, size=20,
            fill_color="gray", hover_fill_color="skyblue",	# 마우스가 객체 위치에 갔을 때 동작
            fill_alpha=0.1, hover_alpha=0.4,
            line_color=None, hover_line_color="white")
p.add_tools(HoverTool(tooltips=None, renderers=[cr], mode="hline"))

show(p)

축 (Axes)
x = np.random.randint(1, 10, 10)
y = np.random.randint(1, 10, 10)

p = figure(plot_width=400, plot_height=400)
p.asterisk(x, y, size=10, line_width=1)
p.xaxis.major_label_orientation = np.pi/4	# 기울이기
p.yaxis.major_label_orientation = "vertical"	# vertical 방향으로 기울이기

show(p)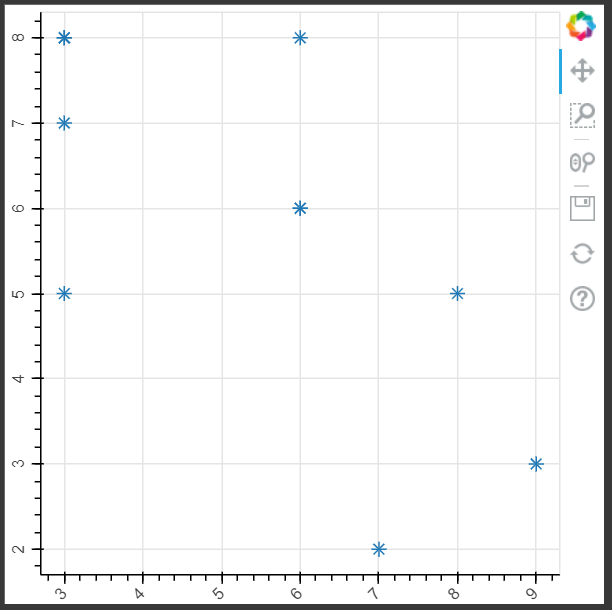
x = np.random.randint(1, 10, 10)
y = np.random.randint(1, 10, 10)

p = figure(plot_width=400, plot_height=400)
p.x(x, y, size=10, color="red")
p.xaxis.axis_label = "x axis"
p.xaxis.axis_line_width = 2
p.xaxis.axis_line_color = "blue"
p.yaxis.axis_label = "y axis"
p.yaxis.major_label_text_color = "orange"
p.yaxis.major_label_orientation = "vertical"
p.axis.minor_tick_in = -5	# 안 눈금
p.axis.minor_tick_out = 5	# 바깥 눈금

show(p)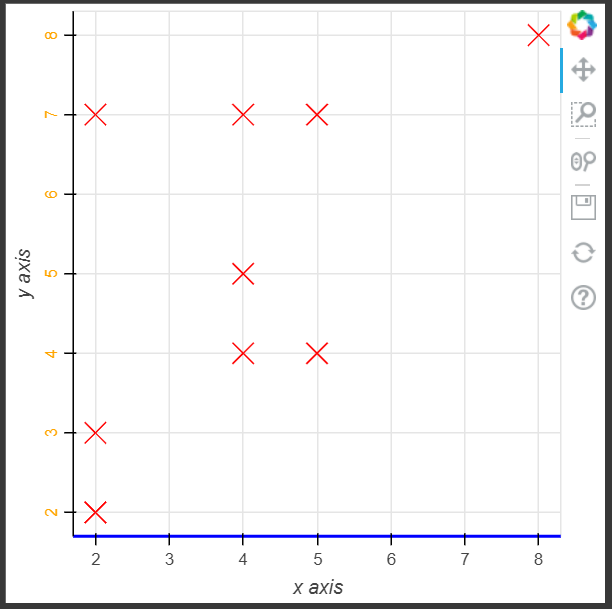
틱 라벨
from bokeh.sampledata.glucose import data

week = data.loc['2010-04-01':'2010-04-07']

p = figure(x_axis_type="datetime", plot_height=300, plot_width=800)
p.xaxis.formatter.days = '%m/%d/%Y'	# datetime정보의 format 설정
p.xaxis.major_label_orientation = np.pi/3
p.line(week.index, week.glucose)

show(p)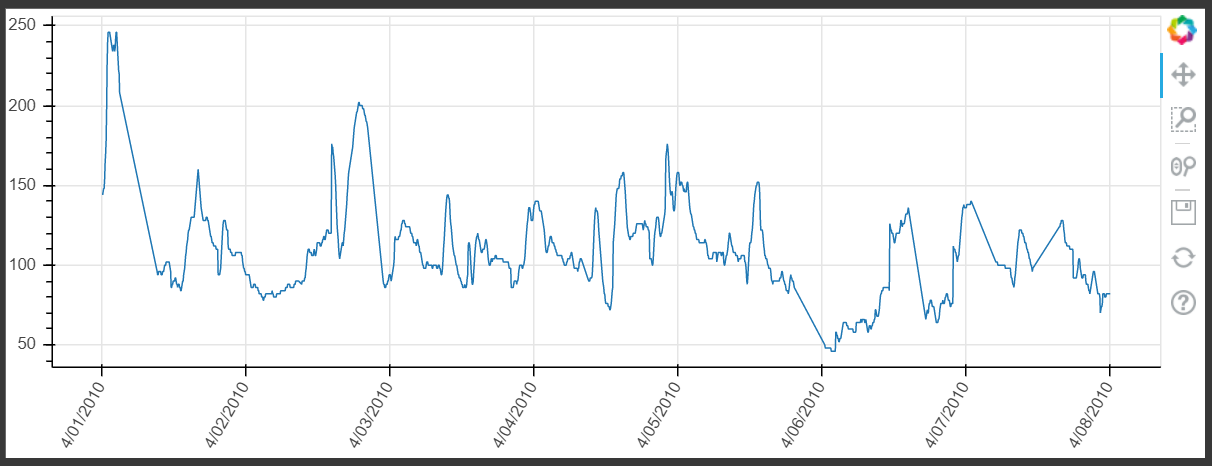
from bokeh.models import NumeralTickFormatter

x = np.arange(1, 11)
y = [i * 1000 for i in np.random.randint(5, 50, 10)]

p = figure(plot_width=800, plot_height=300)
p.circle(x, y, size=10)
p.xaxis.formatter = NumeralTickFormatter(format="0%")	#라이브러리를 통한 format 설정
p.yaxis.formatter = NumeralTickFormatter(format="0,0")

show(p)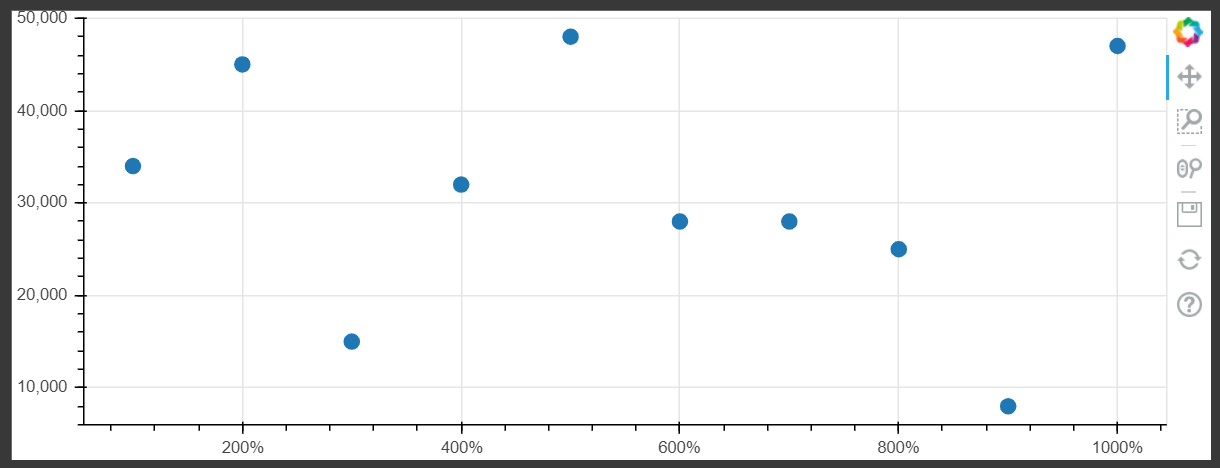
그리드 (Grid)
p = figure(plot_width=400, plot_height=400)
p.circle(x, y, size=10)
p.xgrid.grid_line_color = None	# grid line 설정
p.ygrid.grid_line_alpha = 0.8
p.ygrid.grid_line_dash = [4, 4]

show(p)
p = figure(plot_width=400, plot_height=400)
p.circle(x, y, size=10)
p.xgrid.grid_line_color = None
p.ygrid.band_fill_alpha = 0.1	# band 형태로 속성 설정
p.ygrid.band_fill_color = "blue"

show(p)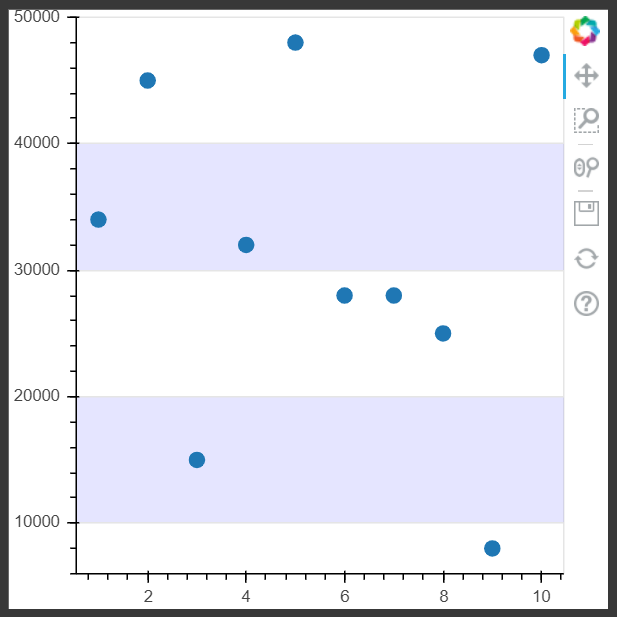
.
'bokeh' 카테고리의 다른 글
| [bokeh] 주석 (Annotations) (0) | 2020.10.05 |
|---|---|
| [bokeh] 데이터 제공 (0) | 2020.10.05 |
| [bokeh] 축 유형 지정 (Specifying Axis Types) (0) | 2020.10.05 |
| [bokeh] 범위 지정 (Setting Ranges) (0) | 2020.10.05 |
| [bokeh] 도형 결합 (Combining Multiple Glyphs) (0) | 2020.10.05 |