728x90
막대, 사각형, 육각타일 (Bar, Rectangle, Hex Tiles)
막대 (Bar)
- vbar
p = figure(plot_width=400, plot_height=400)
p.vbar(x=[1, 2, 3, 4, 5], width=0.5, bottom=0, # vertical bar, 막대 너비 0.5, 최소 값 = 0
       top=[1.2, 2.1, 3.3, 2.9, 1.8], color="darkblue") # top = y축 값
show(p)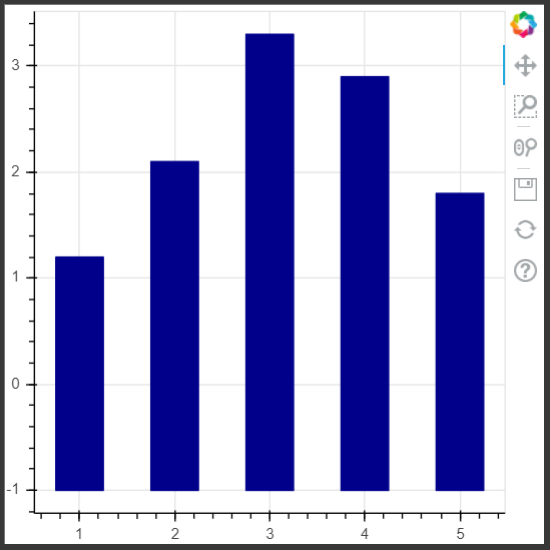
- hbar
p = figure(plot_width=400, plot_height=400)
p.hbar(y=[1, 2, 3, 4, 5], height=0.5, left=0, # horizontal bar, 막대 너비 0.5, left - 최소값 0
       right=[1.2, 2.1, 3.3, 2.9, 1.8], color="darkblue") # right - x축 값
show(p)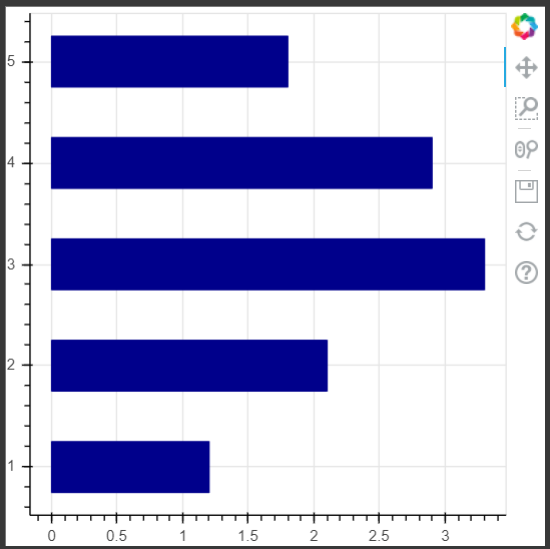
스택 막대 (Stacked Bars)
source = ColumnDataSource(data=dict(
    y = np.arange(20),
    x1 = np.random.randint(10, 40, 20),
    x2 = np.random.randint(20, 60, 20),
))

p = figure(plot_width=400, plot_height=400)
p.hbar_stack(['x1', 'x2'], y ='y', height=0.8,
			 color=('darkblue', 'skyblue'), source=source) # horizontal bar stack
show(p)

사각형 (Rectangles)
quad로 사각형을 표현하며, top, bottom, left, right를 지정해주어서 해당 인덱스에 맞게 사각형을 그려줍니다.
p = figure(plot_width=400, plot_height=400)
p.quad(top=[1.5, 3, 4], bottom=[1, 2, 3], left=[1, 2, 3],
      right=[1.5, 2.5, 4], color="darkred")

show(p)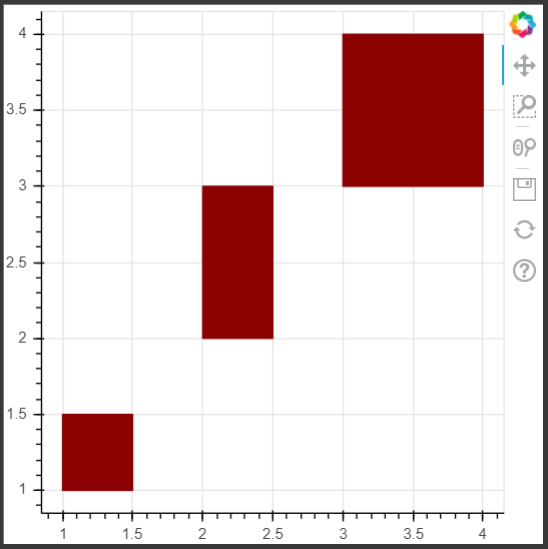
rect
rect로 표현하며, x, y축을 지정해서 해당 위치를 중심으로 사각형을 그립니다
p = figure(plot_width=400, plot_height=400)
p.rect(x=[1, 2, 3, 4, 5], y=[1, 2, 3, 4, 5],
       width=0.5, height=50, color="#127CFF",
       angle=120, height_units="screen")	# angle - 각도
show(p)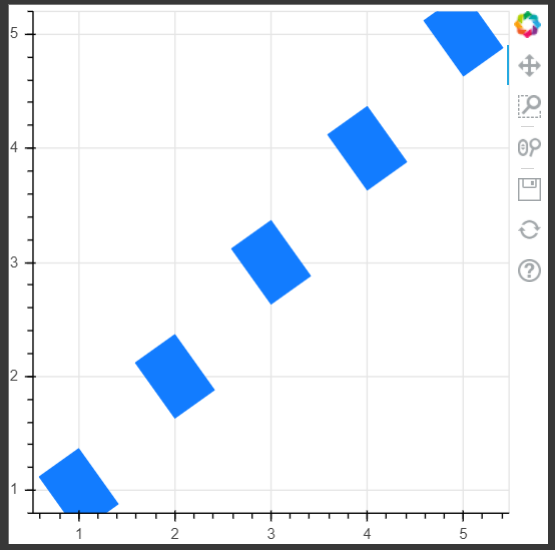
육각 타일 (Hex Tiles)
from bokeh.util.hex import axial_to_cartesian

q = np.array([0, 0, 0, -1, -1, 1, 1])
r = np.array([0, -1, 1, 0, 1, -1, 0])

p = figure(plot_width=400, plot_height=400, toolbar_location=None)	# toolbar_location=None - 툴바 제거
p.grid.visible = False	# grid 제거
p.hex_tile(q, r, size=1, fill_color=["red"]*4 + ["blue"]*3,	# 빨간색 4개, 파란색 3개 지정
                                 line_color="black", alpha=0.5)
x, y = axial_to_cartesian(q, r, 1, "pointytop")	# 육각형 설정
p.text(x, y, text=["(%d, %d)" % (q, r) for (q, r) in zip(q, r)], #해당 좌표 출력
       text_baseline="middle", text_align="center")	# 텍스트를 중앙으로
show(p)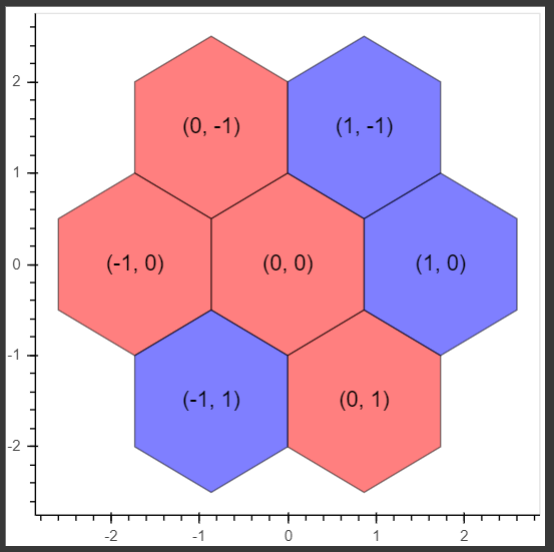
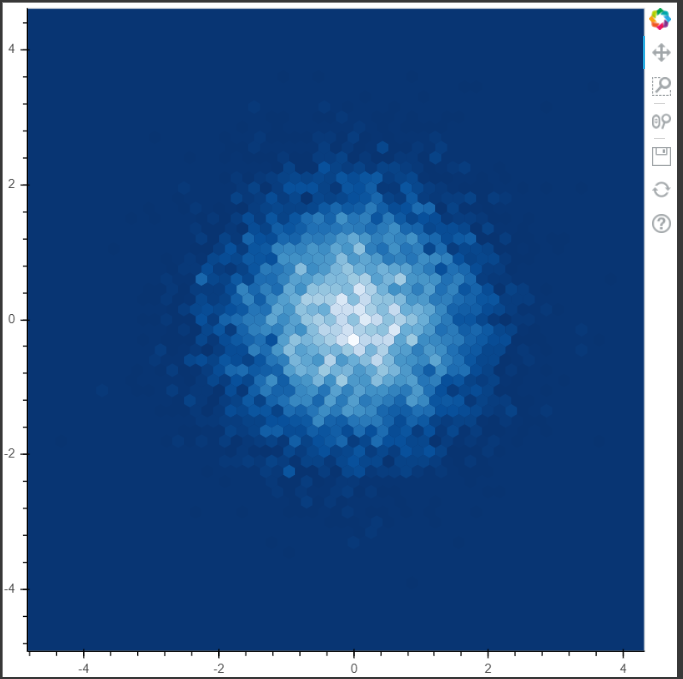
from bokeh.palettes import Blues256	# 색 라이브러리
from bokeh.util.hex import hexbin #

n = 10000
x = np.random.standard_normal(n)
y = np.random.standard_normal(n)

bins = hexbin(x, y, 0.1) # x값, y값, 크기
color = [Blues256[int(i)] for i in bins.counts/max(bins.counts) * 255]	# 색 지정

p = figure(match_aspect=True, background_fill_color='#083573')	# 비율 조정, 배경색 지정
p.grid.visible = False	# grid 제거
p.hex_tile(bins.q, bins.r, size=0.1, line_color=None, fill_color=color)

show(p)
'bokeh' 카테고리의 다른 글
| [bokeh] 패치, 폴리곤 (Patch, Polygons) (0) | 2020.10.05 |
|---|---|
| [bokeh] 영역 (Areas) (0) | 2020.10.05 |
| [bokeh] 라인 플롯 (Line Plots) (0) | 2020.10.04 |
| [bokeh] 산점도(Scatter Plots) (0) | 2020.10.03 |
| [bokeh] 초기설정 (0) | 2020.10.03 |