728x90
x() - x 모양
cross() - +모양
asterisk() - * 모양
circle() - O 모양
circle_cross() - O, + 모양
circle_x() - O, x 모양
triangle -△ 모양
inverted_triangle - ▽ 모양
square() - ㅁ 모양
square_cross() - ㅁ, + 모양
square_x() - ㅁ, x 모양
diamond() - ◇ 모양
diamond_cross() - ◇, + 모양
hex() - 육각형 모양
x, y에 랜덤값 10개를 입력
sz 10~40 사이의 랜덤 값으로 설정
x = np.random.randn(10)	# x에 랜덤 값 10개
y = np.random.randn(10) # y에 랜덤 값 10개
sz = np.random.randint(10, 40, size=10) # sz에 10~40의 랜덤 값 10개
x()
p = figure(plot_width=400, plot_height=400) # 400 * 400 figure 생성
p.x(x, y, size=10) # x모양의 size 10인 산점도 생성
show(p) # 출력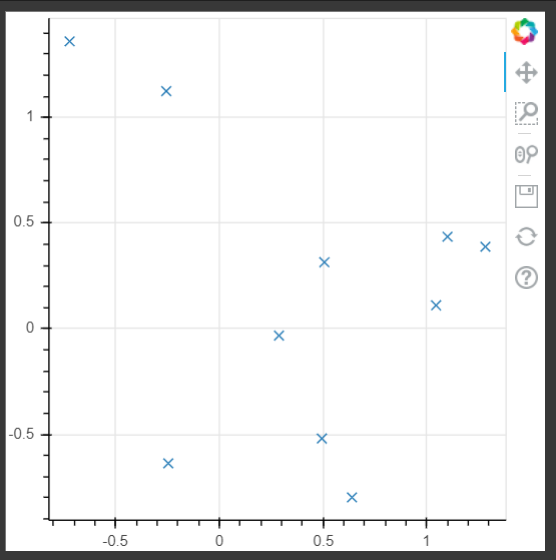
cross()
p = figure(plot_width=400, plot_height=400) #400 * 400 figure 생성
p.cross(x, y, size=10) #cross모양의 산점도 생성
show(p) # 출력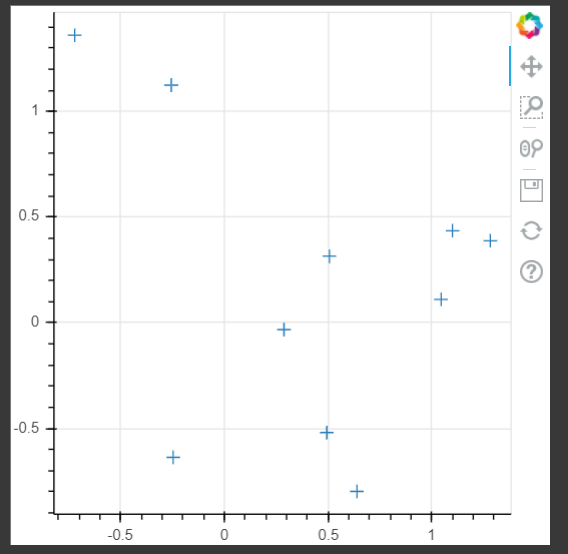
asterisk()
p = figure(plot_width=400, plot_height=400) #400 * 400 figure 생성
p.asterisk(x, y, size=sz, line_color="gray") #*모양 회색 산점도
show(p) # 출력
circle()
p = figure(plot_width=400, plot_height=400) #400 * 400 figure 생성
p.circle(x, y, size=sz, line_color="navy", fill_color="blue", fill_alpha=0.5) #O모양 테두리 navy, 안 파랑색, 투명도 50% 산점도
show(p) # 출력
circle_cross()
p = figure(plot_width=400, plot_height=400) #400 * 400 figure 생성
p.circle_cross(x, y, size=sz, line_color="navy", fill_color="blue", fill_alpha=0.5) #O+모양 테두리 navy, 안 파랑색, 투명도 50% 산점도
show(p) # 출력
circle_x()
p = figure(plot_width=400, plot_height=400) #400 * 400 figure 생성
p.circle_x(x, y, size=sz, line_color="navy", fill_color="blue", fill_alpha=0.5) #OX모양 테두리 navy, 안 파랑색, 투명도 50% 산점도
show(p) # 출력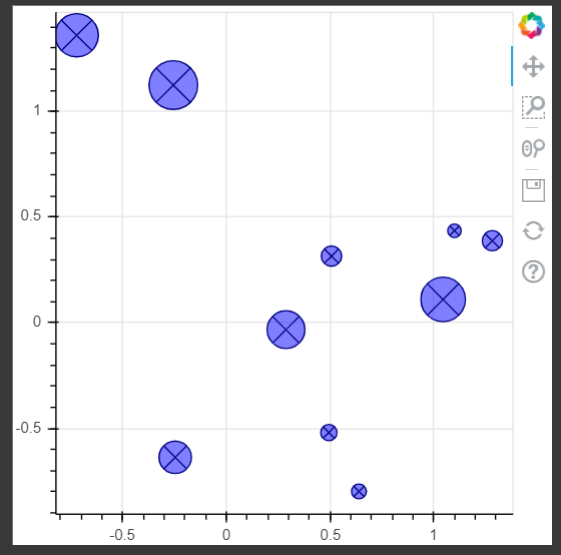
triangle()
p = figure(plot_width=400, plot_height=400) #400 * 400 figure 생성
p.triangle(x, y, size=sz, color="orange", alpha=0.5) #삼각형 모양 오렌지 투명도 50% 산점도
show(p) # 출력
inverted_triangle()
p = figure(plot_width=400, plot_height=400) #400 * 400 figure 생성
p.inverted_triangle(x, y, size=sz, color="orange", alpha=0.5) #역삼각형 모양 오렌지 투명도 50% 산점도
show(p) # 출력
square()
p = figure(plot_width=400, plot_height=400) #400 * 400 figure 생성
p.square(x, y, size=sz, color="green", alpha=0.5) #사각형 모양 오렌지 투명도 50% 산점도
show(p) # 출력
square_cross()
p = figure(plot_width=400, plot_height=400) #400 * 400 figure 생성
p.square_cross(x, y, size=sz, color="green", alpha=0.5) #사각형, + 모양 오렌지 투명도 50% 산점도
show(p) # 출력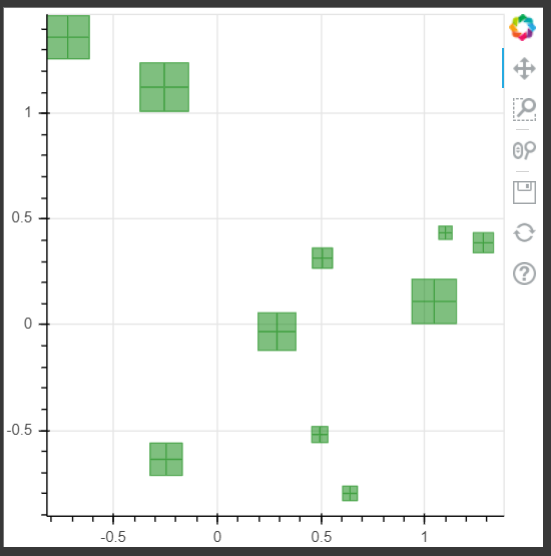
square_x()
p = figure(plot_width=400, plot_height=400) #400 * 400 figure 생성
p.square_x(x, y, size=sz, color="green", alpha=0.5) #사각형, x 모양 오렌지 투명도 50% 산점도
show(p) # 출력
diamond()
p = figure(plot_width=400, plot_height=400) #400 * 400 figure 생성
p.diamond(x, y, size=sz, color="skyblue", alpha=0.5) #다이아 모양 하늘 투명도 50% 산점도
show(p) # 출력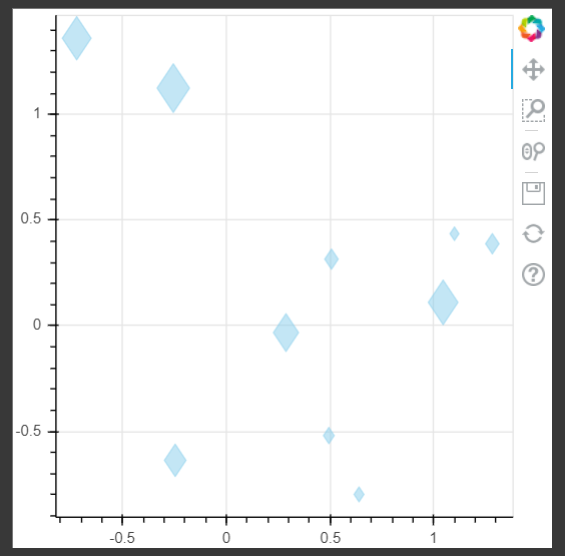
diamond_cross()
p = figure(plot_width=400, plot_height=400) #400 * 400 figure 생성
p.diamond_cross(x, y, size=sz, fill_color="skyblue", fill_alpha=0.5) #다이아. + 모양 칠색 하늘, 칠색 투명도 50% 산점도
show(p) # 출력
hex()
p = figure(plot_width=400, plot_height=400) #400 * 400 figure 생성
p.hex(x, y, size=sz, color="purple", alpha=0.5) #육각형 모양 보라, 투명도 50% 산점도
show(p) # 출력
engine과 관련된 sample 데이터를 가져와서 진행
from bokeh.sampledata.autompg import autompg #autompg 샘플 데이터 활용
autompg.head() #autompg의 앞부분 테이블 확인
p = figure(plot_width=400, plot_height=400) # 400*400
p.hex(autompg.hp, autompg.mpg, size=autompg.cyl, color="darkblue", alpha=0.5) #x축 hp, y축 mpg, size cyl
p.xaxis.axis_label = 'horse power' #x축 label 값 설정
p.yaxis.axis_label = 'mpg' #y축 label 값 설정
show(p)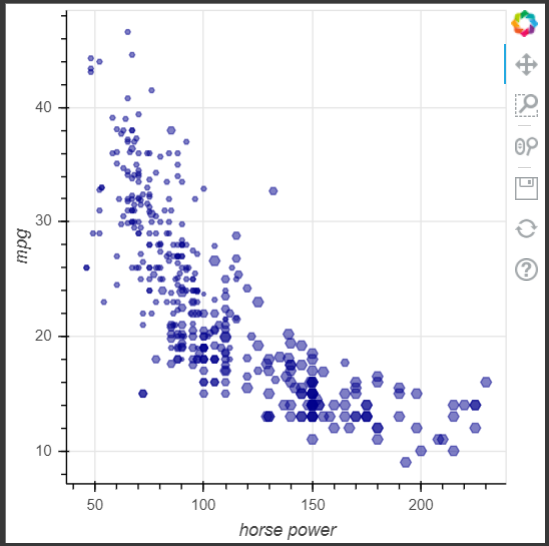
.
'bokeh' 카테고리의 다른 글
| [bokeh] 막대, 사각형, 육각 타일 (0) | 2020.10.04 |
|---|---|
| [bokeh] 라인 플롯 (Line Plots) (0) | 2020.10.04 |
| [bokeh] 초기설정 (0) | 2020.10.03 |
| [bokeh] colab 환경 (0) | 2020.10.03 |
| [bokeh] bokeh란? (0) | 2020.10.03 |