from bokeh.models import ColumnDataSource
from bokeh.palettes import Spectral6

cities = ['서울특별시', '부산광역시', '인천광역시',
          '대구광역시', '대전광역시', '광주광역시']
pops = [9720846, 3404423, 2947217, 2427954, 1471040, 1455048]
source = ColumnDataSource(data=dict(cities=cities, pops=pops, color=Spectral6))

p = figure(x_range=cities, plot_height=300, y_range=(0, 10000000), title="Populations")
p.vbar(x='cities', top='pops', width=0.7, color='color', legend_field='cities', source=source)
p.xgrid.grid_line_color=None
p.legend.orientation = "vertical"
p.legend.location = "top_right"

show(p)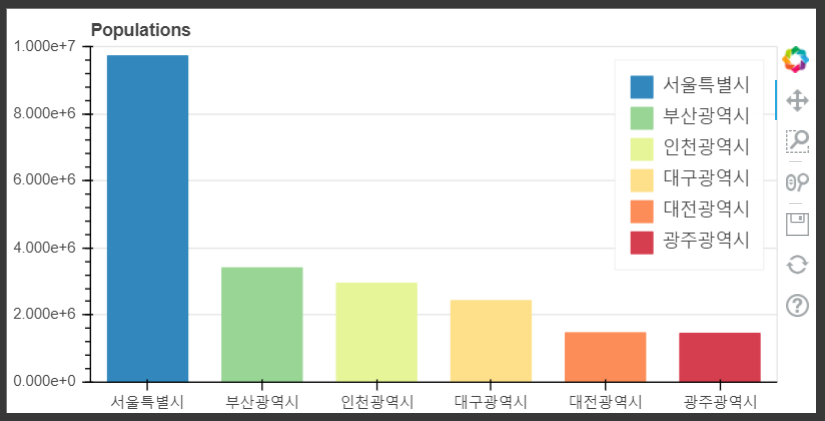
from bokeh.palettes import GnBu3, PuBu3

years = ['2018', '2019', '2020']
cities = ['서울특별시', '부산광역시', '인천광역시',
          '대구광역시', '대전광역시', '광주광역시']
male = {'cities' : cities,
        '2018' : [-4802769, -1700822, -1481769, -1224126, -747071, -723562],
        '2019' : [-4762711, -1683596, -1482934, -1212450, -740834, -722559],
        '2020' : [-4732274, -1668618, -1476813, -1198815, -734441, -720060]}
female = {'cities' : cities,
        '2018' : [5011280, 1754789, 1472114, 1245491, 747807, 737183],
        '2019' : [4994433, 1744036, 1474090, 1238028, 742104, 736465],
        '2020' : [4988571, 1735805, 1470404, 1229139, 736599, 734988]}

p = figure(y_range=cities, plot_height=250, x_range=(-16000000, 16000000))
p.hbar_stack(years, y='cities', height=0.8, color=GnBu3, source=ColumnDataSource(male),
             legend_label=["%s 남자" % x for x in years])
p.hbar_stack(years, y='cities', height=0.8, color=PuBu3, source=ColumnDataSource(female),
             legend_label=["%s 여자" % x for x in years])
p.y_range.range_padding = 0.1
p.ygrid.grid_line_color = None
p.legend.location = "top_right"

show(p)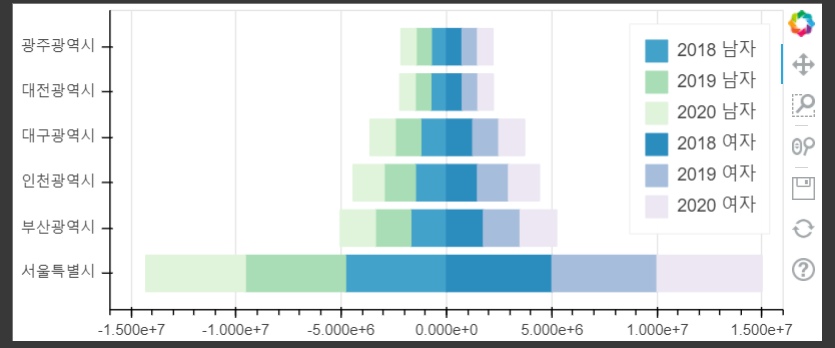
from bokeh.transform import factor_cmap

x = [ (city, year) for city in cities for year in years ]
pops = sum(zip(female['2018'], female['2019'], female['2020']), ())
source = ColumnDataSource(data=dict(x=x, pops=pops))

p = figure(x_range=FactorRange(*x), plot_height=250, title="Female Population by Year")
p.vbar(x='x', top='pops', width=0.8, source=source, line_color="white",
       fill_color=factor_cmap('x', palette=['skyblue', 'royalblue', 'darkblue'],
                              factors=years, start=1, end=2))
p.y_range.start = 0
p.x_range.range_padding = 0.1
p.xaxis.major_label_orientation = 1
p.xgrid.grid_line_color = None

show(p)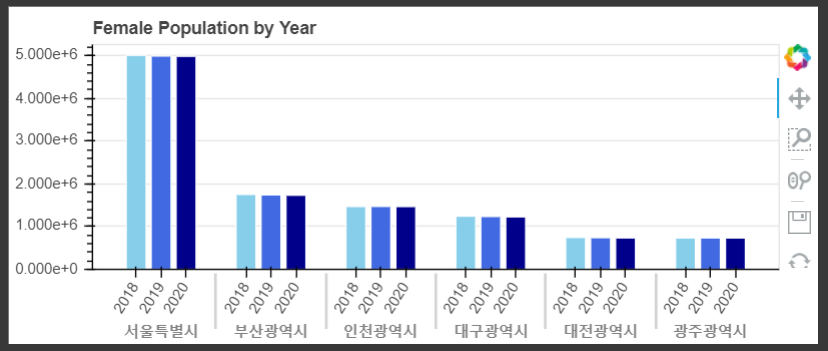
from bokeh.sampledata.commits import data
from bokeh.transform import jitter
days = ["Sun", "Sat", "Fri", "Thu", "Wed", "Tue", "Mon"]
source = ColumnDataSource(data)

p = figure(plot_width=800, plot_height=300,
           y_range=days, x_axis_type='datetime')
p.circle(x='time', y=jitter('day', width=0.6, range=p.y_range),
         color="orange", source=source, alpha=0.4)
p.xaxis[0].formatter.days = ['%Hh']
p.x_range.range_padding = 0
p.ygrid.grid_line_color = None

show(p)
.
'bokeh' 카테고리의 다른 글
| [bokeh] 내보내기(Exporting) (0) | 2020.10.05 |
|---|---|
| [bokeh] 위젯 (Widgets) (0) | 2020.10.05 |
| [bokeh] 연결된 상호작용 (Linked Interactions) (0) | 2020.10.05 |
| [bokeh] 레이아웃 (Layout) (0) | 2020.10.05 |
| [bokeh] 주석 (Annotations) (0) | 2020.10.05 |